It takes 18-years (d0h!)
The news is filled with stories predicting higher education’s demise. Whether derived from falling enrollments around the country, high cost of tuition to attend college, the irrelevance(!?) of a college degree to a lifetime of employment, or simply political rhetoric, higher-ed is under persistent criticism. Rhetoric aside, what does data say about the state of higher ed? I was introduced to the book, Demographics and the demand for higher education, in April and read it then as a reference. Something new compelled me to read it with a data perspective and it revealed a few interesting thoughts.

Whatever faces a college today isn’t simply a function of the college admissions office or the school guidance counselors. The student who matriculates into a freshman class is a product of at least 18-years of interactions. The author takes us through a bit of history and (quite) a bit of data. Here are the highlights.
The demographic headwinds
The US faces a trifecta of demographic headwinds, the first of which defines the country itself – immigration. Hispanic and Asian immigrants comprise a majority of the 2.3 to 4.4 new legal immigrants per 1000 existing citizens and settle in enclaves around the country. The second is migration within the US with a measurable move from the northeast and Pacific areas toward the south. The remaining move is generally a zero-sum. Fertility, the third factor, is dropping below the threshold of 2.05/female. Texas is the only populous state among the growing states to reach this threshold.
High school graduation
This was a startling statistic for me. The projected number of high school graduates shifts from 3.45M in 2012 to 3.375M in 2007 to an expected peak of nearly 3.5M in 2025 before cratering to 3.25M by 2032. What’s more startling is the drop by ethnicity where white graduates increase only in MT, SD, ND, KS, TX and OK! A majority of the states’ graduates through 2032 will be of Hispanic, Black and Asian descent. The author’s graphic below displays this shift:
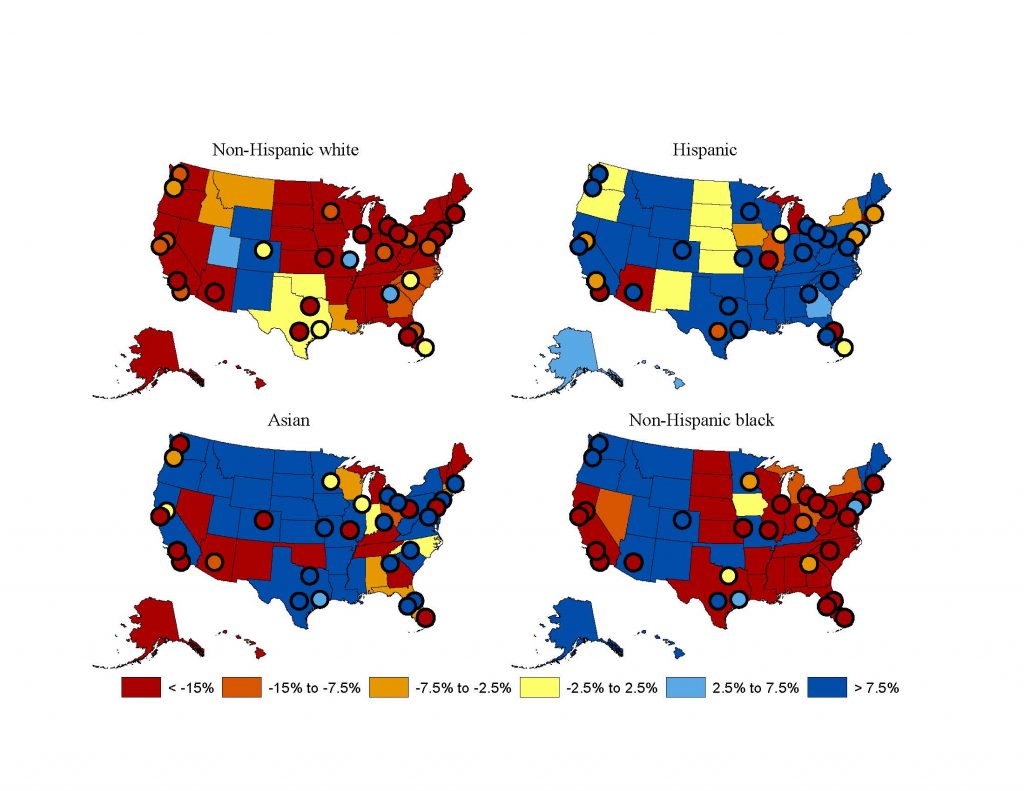
Ethnicity is important because the four segments show a distinct difference in where students typically go to college. Whether one or both parents went to college influences if their children will attend college. The midwest, northeast and Pacific regions, typical destinations for non-Hispanic white students will most certainly suffer or have to redefine themselves!
Higher Education Demand
The author studies the factors impacting demand for higher education. Parents’ education levels directly correlate with what their children pursue in college – a 2-year, a 4-year or no-degree. Migration patterns and parent ethnicity seem to impact the elasticity of demand in certain regions, but, the migration at a macro level seems like a constant.
Diversity
The data projects what is likely to happen to diversity on campuses. With non-Hispanic white students falling in numbers with a corresponding increase in Asian students, non-Hispanic black students, however, will experience a significant decline. Campuses will look different, won’t they?
A concurrent shift in parents of the enrolled students will show that a significant number of them have one or both parents with at least a Bachelors degree. Think about this – if parents with BAs present children to four-year colleges, does it predict a drop in two-year college enrollments? Yep. Data can accurately predict an uptick in the mid-2020s followed by a precipitous decline at two-year colleges. Remember the ‘it takes 18-years’ rule? Yet, four-year colleges’ gain still results in fewer overall students due to demographics showing fewer numbers of prospective 18-year olds available to go to even these colleges.
So, who will feel this demand most? Another important statistic highlights the impact on schools that attract students regionally or nationally vs the elite institutions. Regional schools attract students from within a few dozen miles, National schools from nearly 200 miles, and Elite institutions who attract students universally. The Elite institutions, despite the lowering population, may still fare well because of their ability to stand above the rest whereas the regional institutions in many parts of the US will need to redefine themselves.
Final takeaways
The latter third of the book shifts toward attitudes toward paying for college, how individual institutions will redefine themselves, and the effects of policy on higher ed. These latter variables could upend the entire demographic impact and shift the face of higher education across America.
I will try to remember
- You must begin with the demographics of the markets first to study why higher-ed is undergoing a seismic shift, and
- There is no homogeneous solution to the shift. Each institution will have to redefine itself within its shifting market.
Change is constant, even in the glacial movement of academia!
If you want to study this in further detail, start by grabbing the book from the link in the first paragraph. Source data are available at the author’s page at https://people.carleton.edu/~ngrawe/HEDI.htm.